prodfiler-documentation
Prodfiler feature reference
- Managing projects
- Traces
- Functions
- Flamegraph
- Filtering the results
- Missing symbols
- Host agent configuration flags
Managing projects
Sharing your project with other users
You can share a single project among multiple users by clicking on the three dots to the right of the project name and selecting “People”:
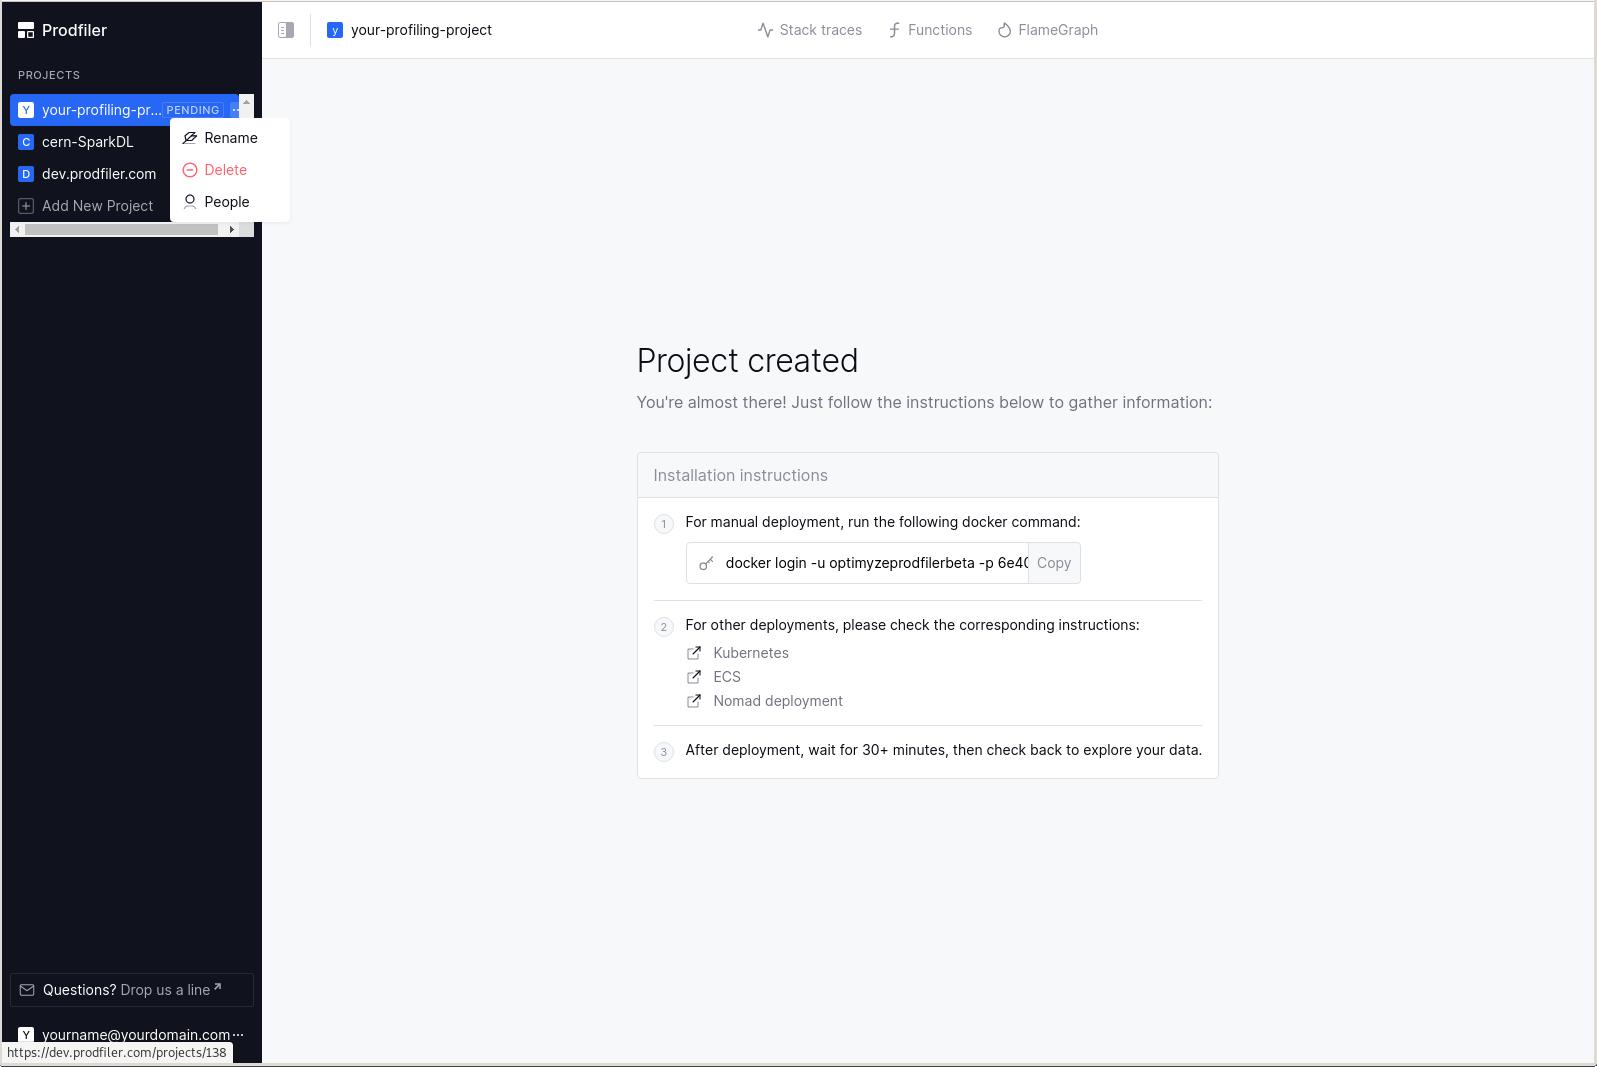
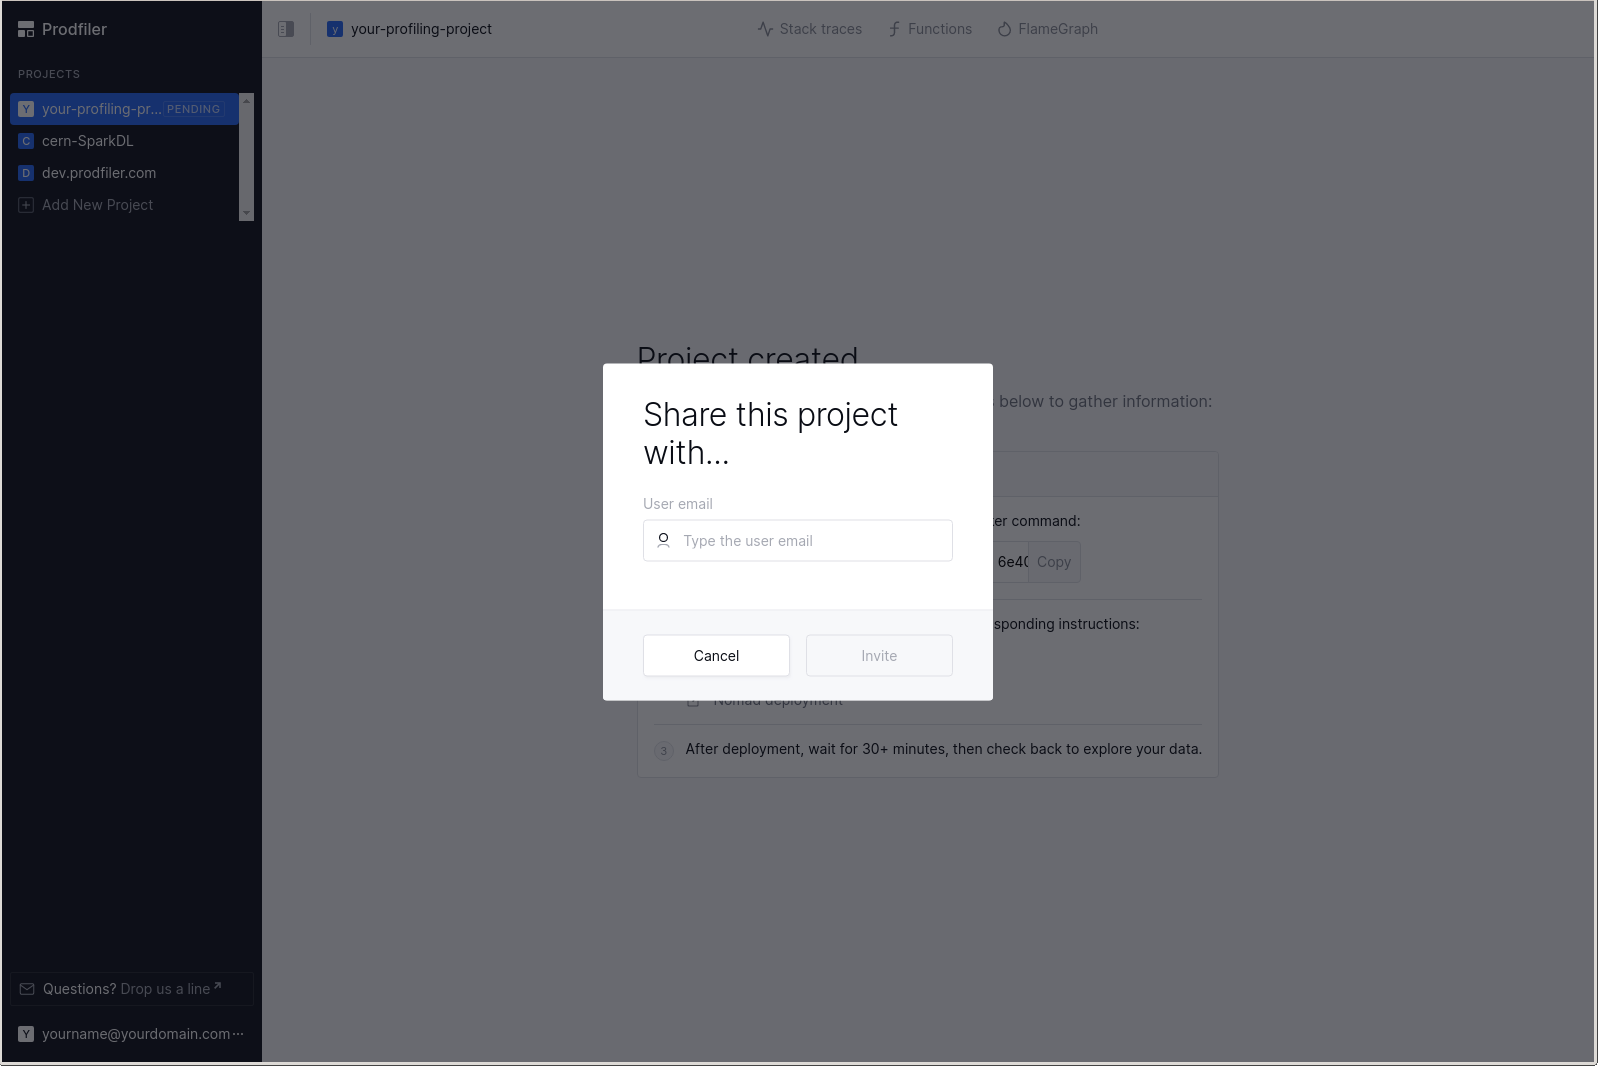
You will need to write the full email address of the other user you wish to share the project with.
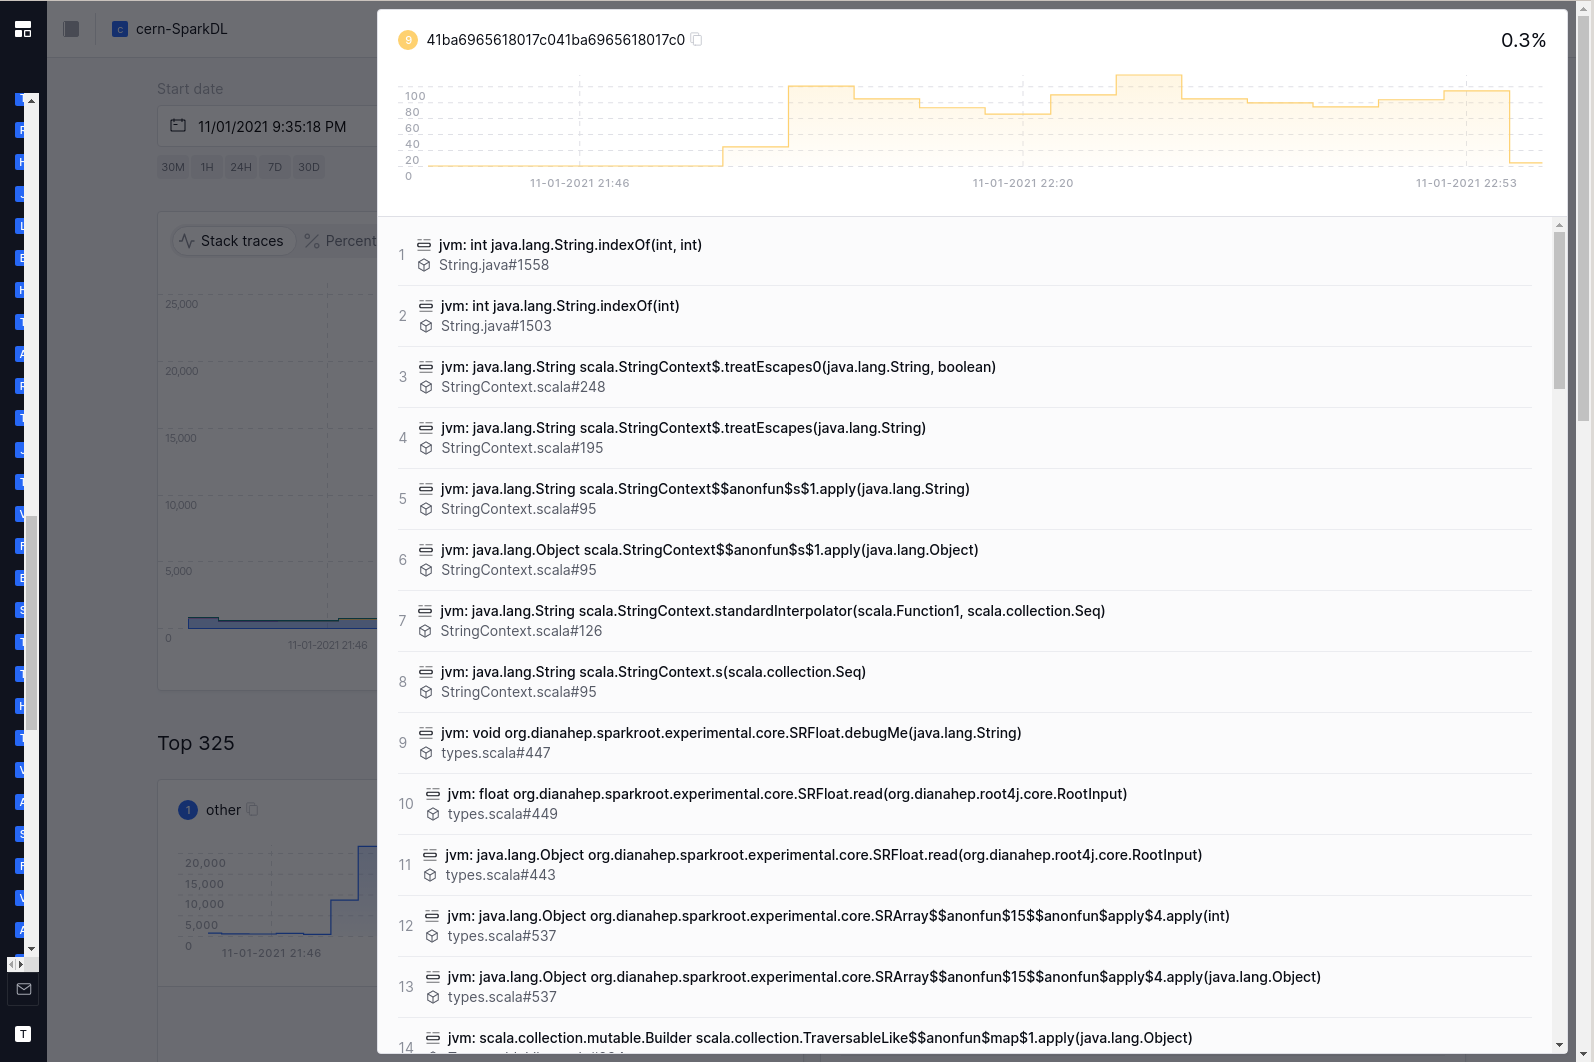
The Traces view
This is a view of all stack traces recorded over time.
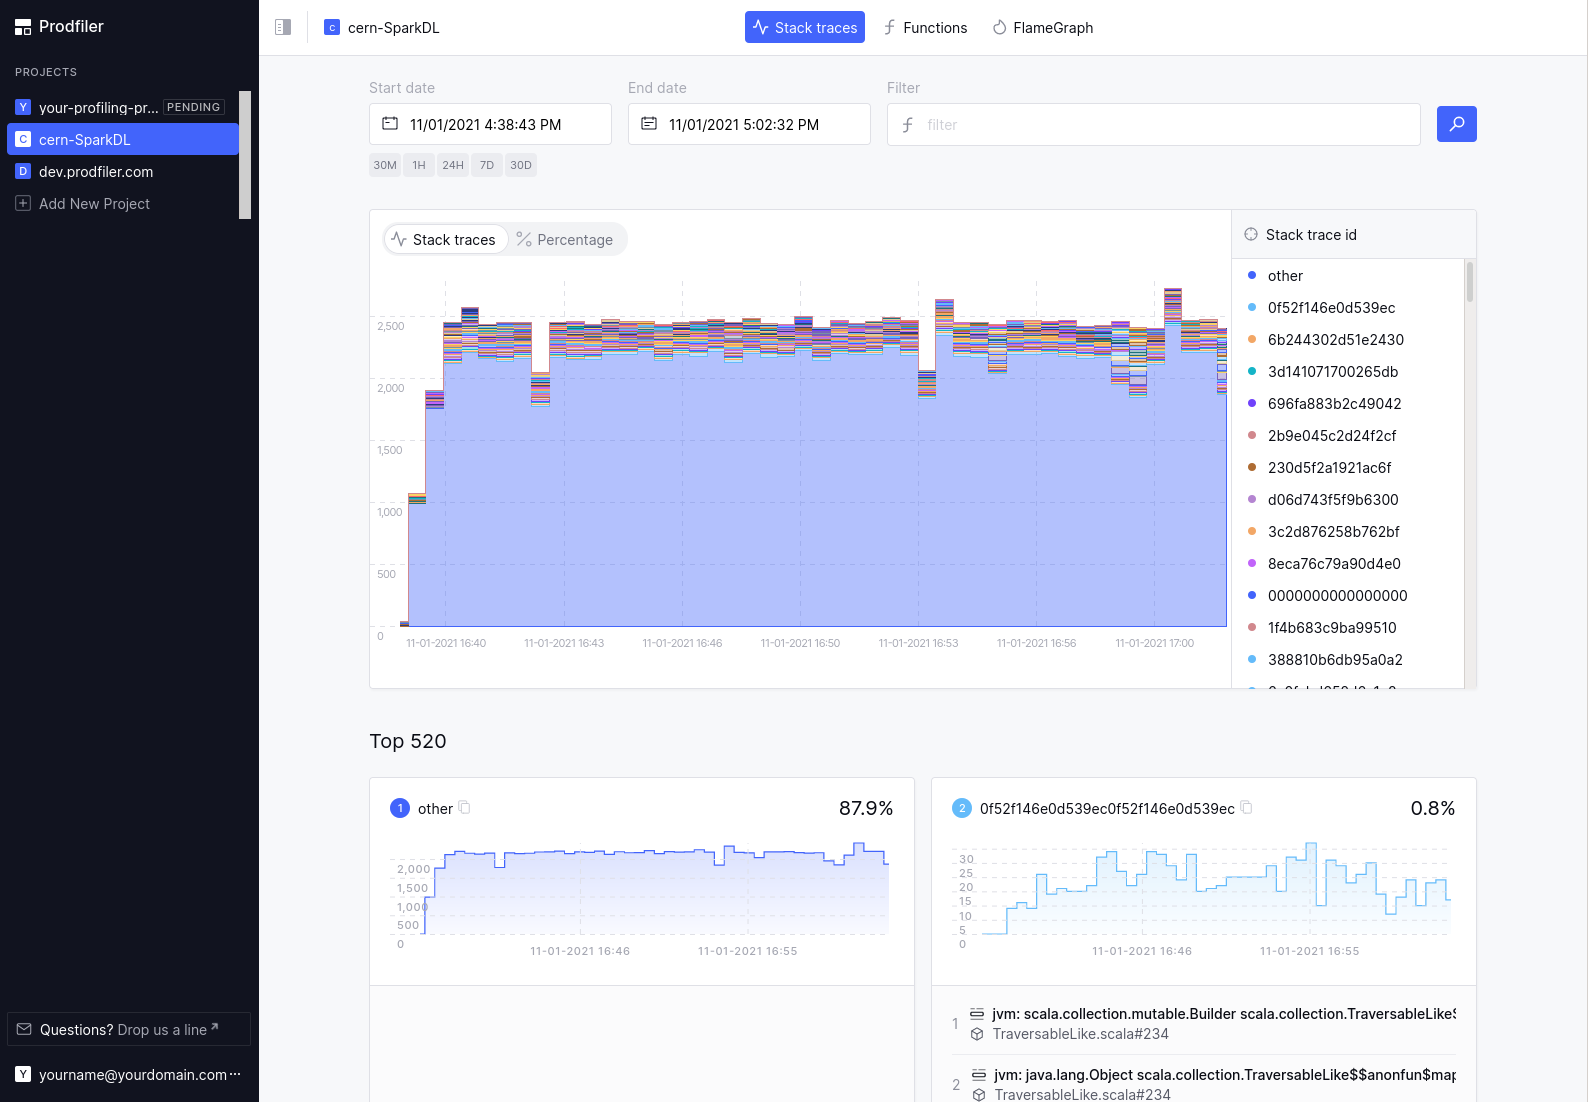
Normally, you will have a large chunk (80%+) of traces in the category “other” (which means they are quite rare individually, and are grouped into a big chunk), and a few hundred stack traces shown in the “Top XXX” list below.
The UI subdivides the time interval that you are looking at into smaller chunks, and for each time chunk Prodfiler retrieves the top-50 most common stack traces. These are then displayed in the diagram. Because each time chunk may have a different top-50-most-common stack trace, you may end up with a few hundred stack traces that are made explicit (e.g. not grouped into the “other” category).
The number of traces collected at a given point in time is correlated to overall CPU load - an idle machine will generate fewer traces than a machine running at full load, as cores sent to sleep will not generate traces in Prodfiler.
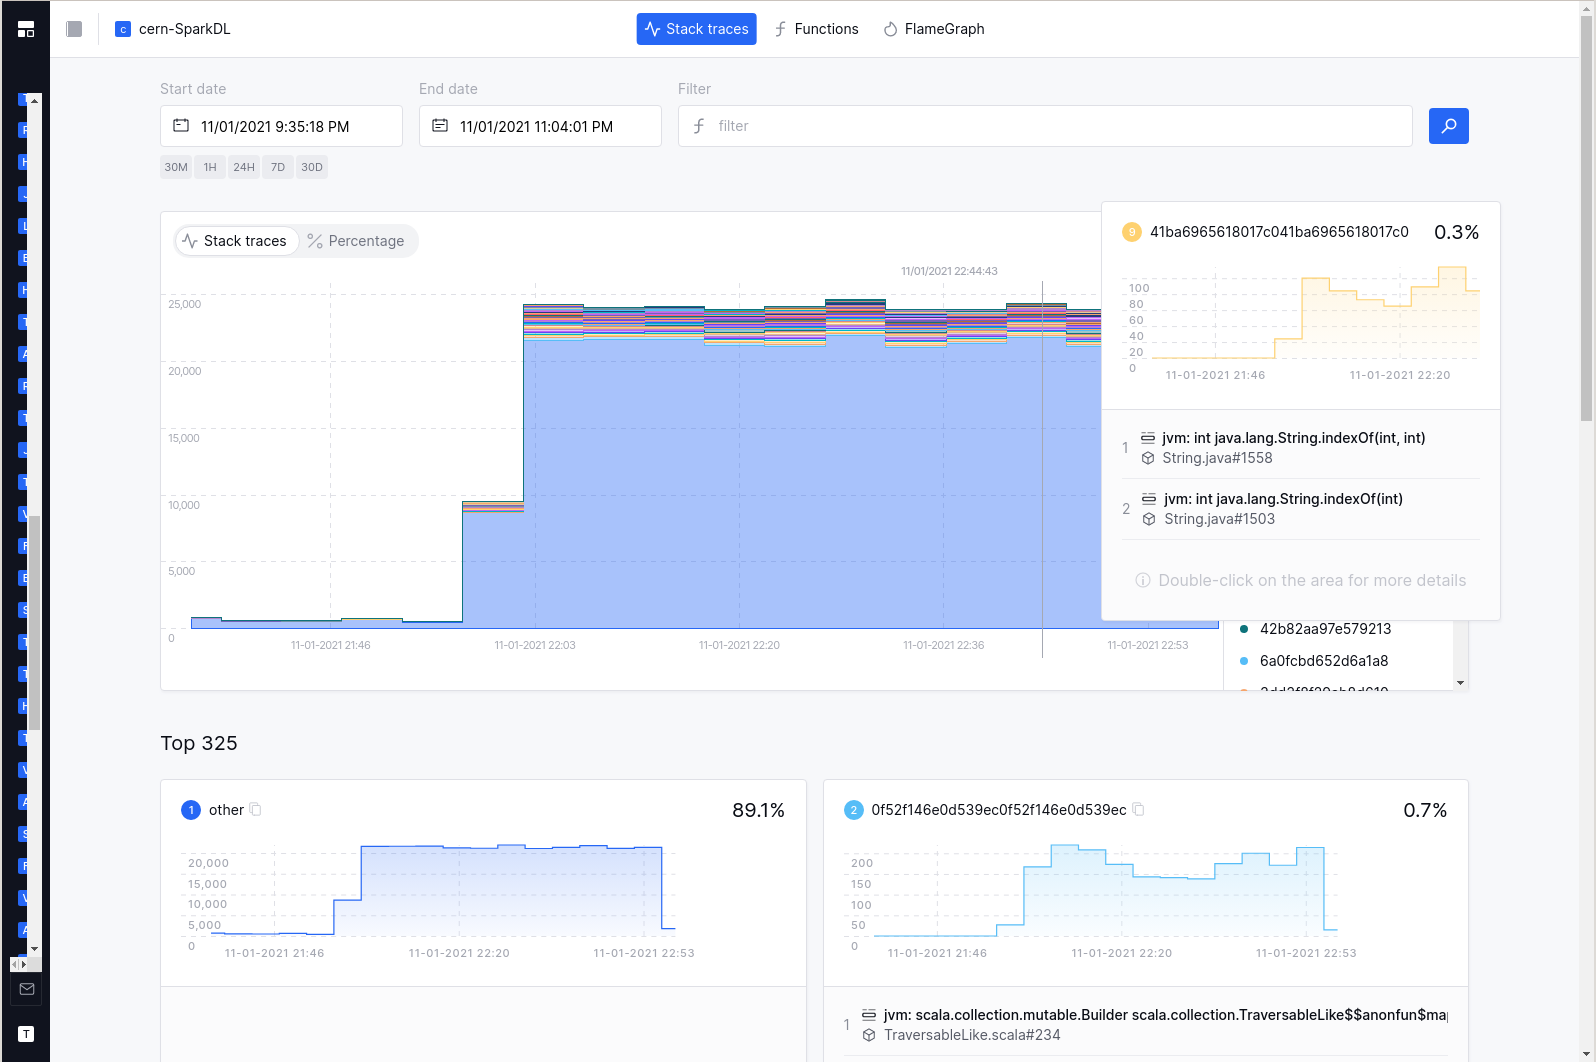
Clicking on one of the “30M”, “1H”, “24H”, “7D”, “30D” buttons will switch the web interface to display the current point in time minus 30 minutes, 1 hour, etc.
Click-and-drag into the chart allows you to drill down on a particular timeframe. Single-click on a block in the diagram will pull up the last two stack frames associated with that trace, providing a bit more context – a double-click will pop up a window with all stack frames of the trace.
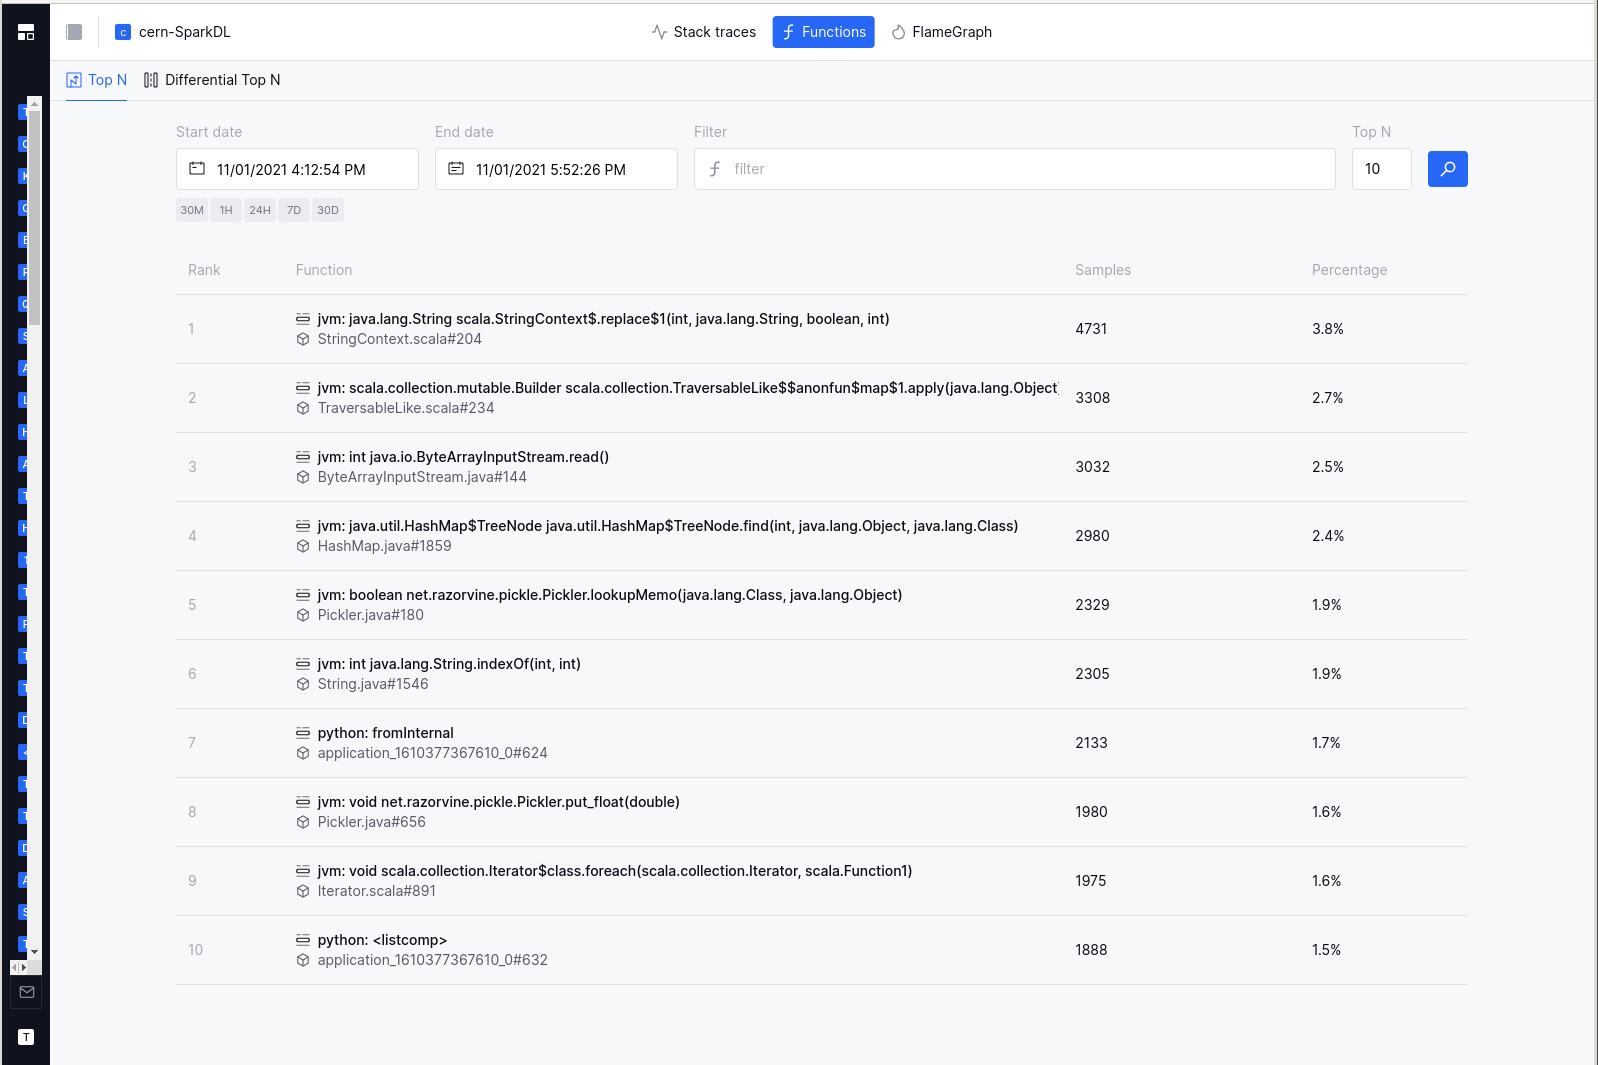
The Functions view
Aside from inspecting the most common traces, you can also inspect the most common functions. Simply click on the “functions” button in the top navigation bar. The time interval you have already selected will stay the same.
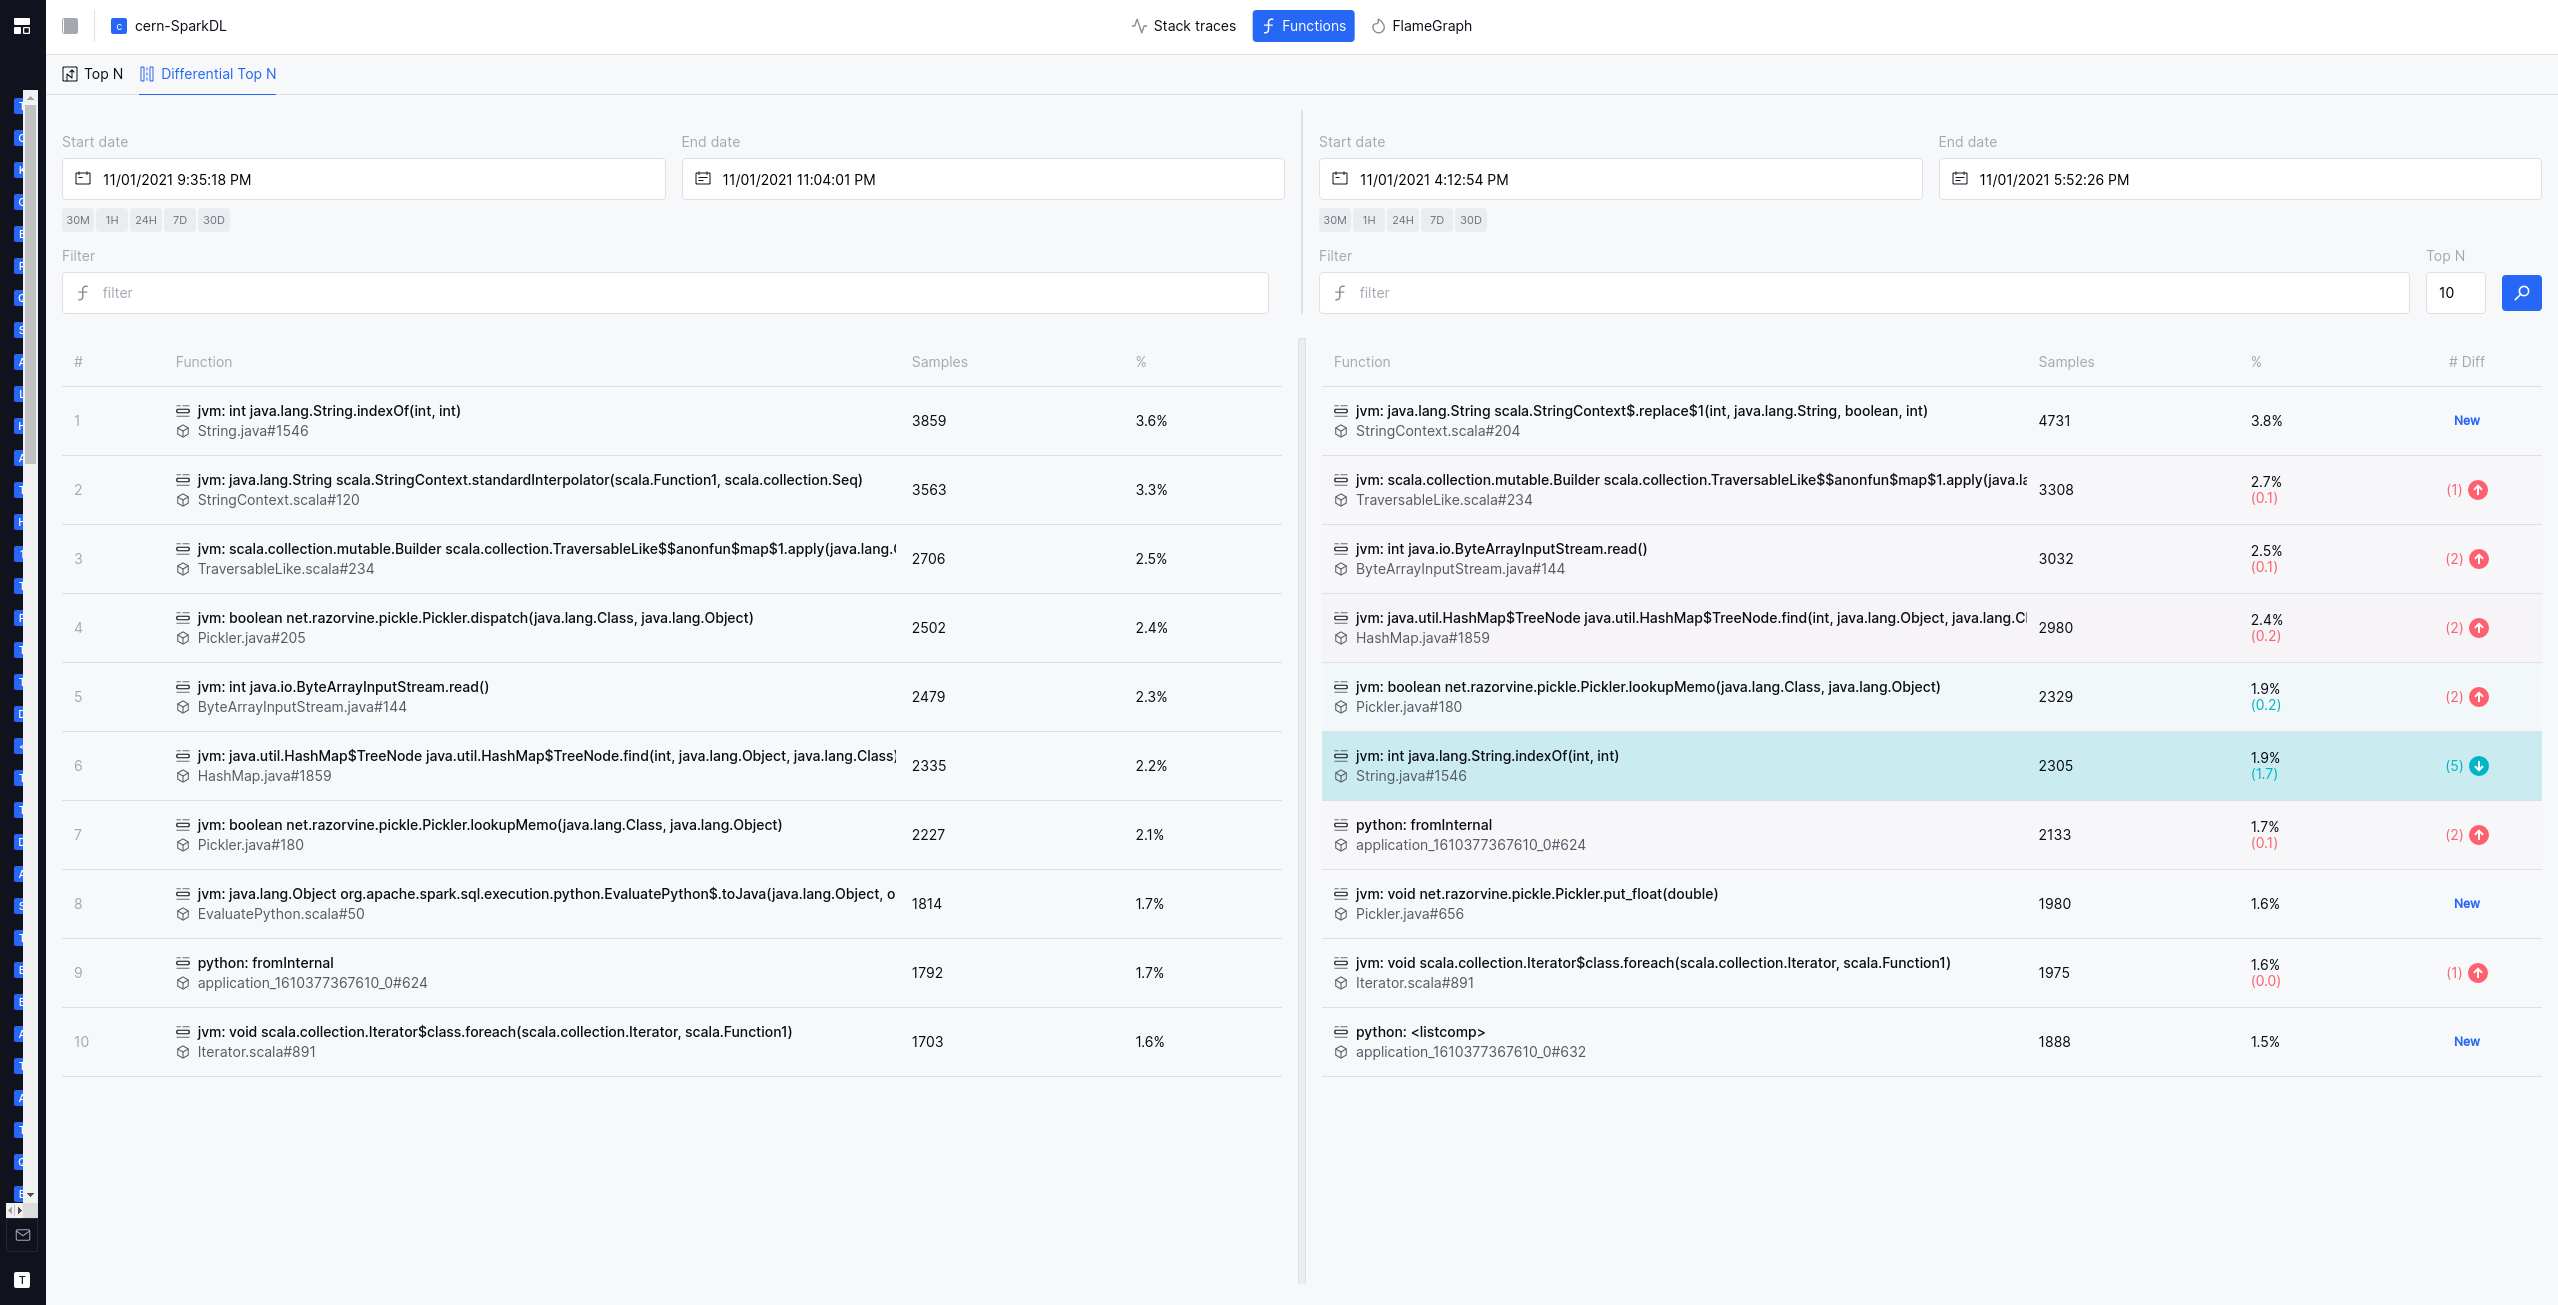
Comparing the Top-N functions between two time intervals
It can often be helpful to compare two timeframes or subsets of machines - identifying which functions got relatively more expensive or relatively less expensive. In the “differential Top-N” view, you can do just that: Specify two different time frames (or two different subsets of machines using the filter language), and see which functions got more expensive or less expensive.
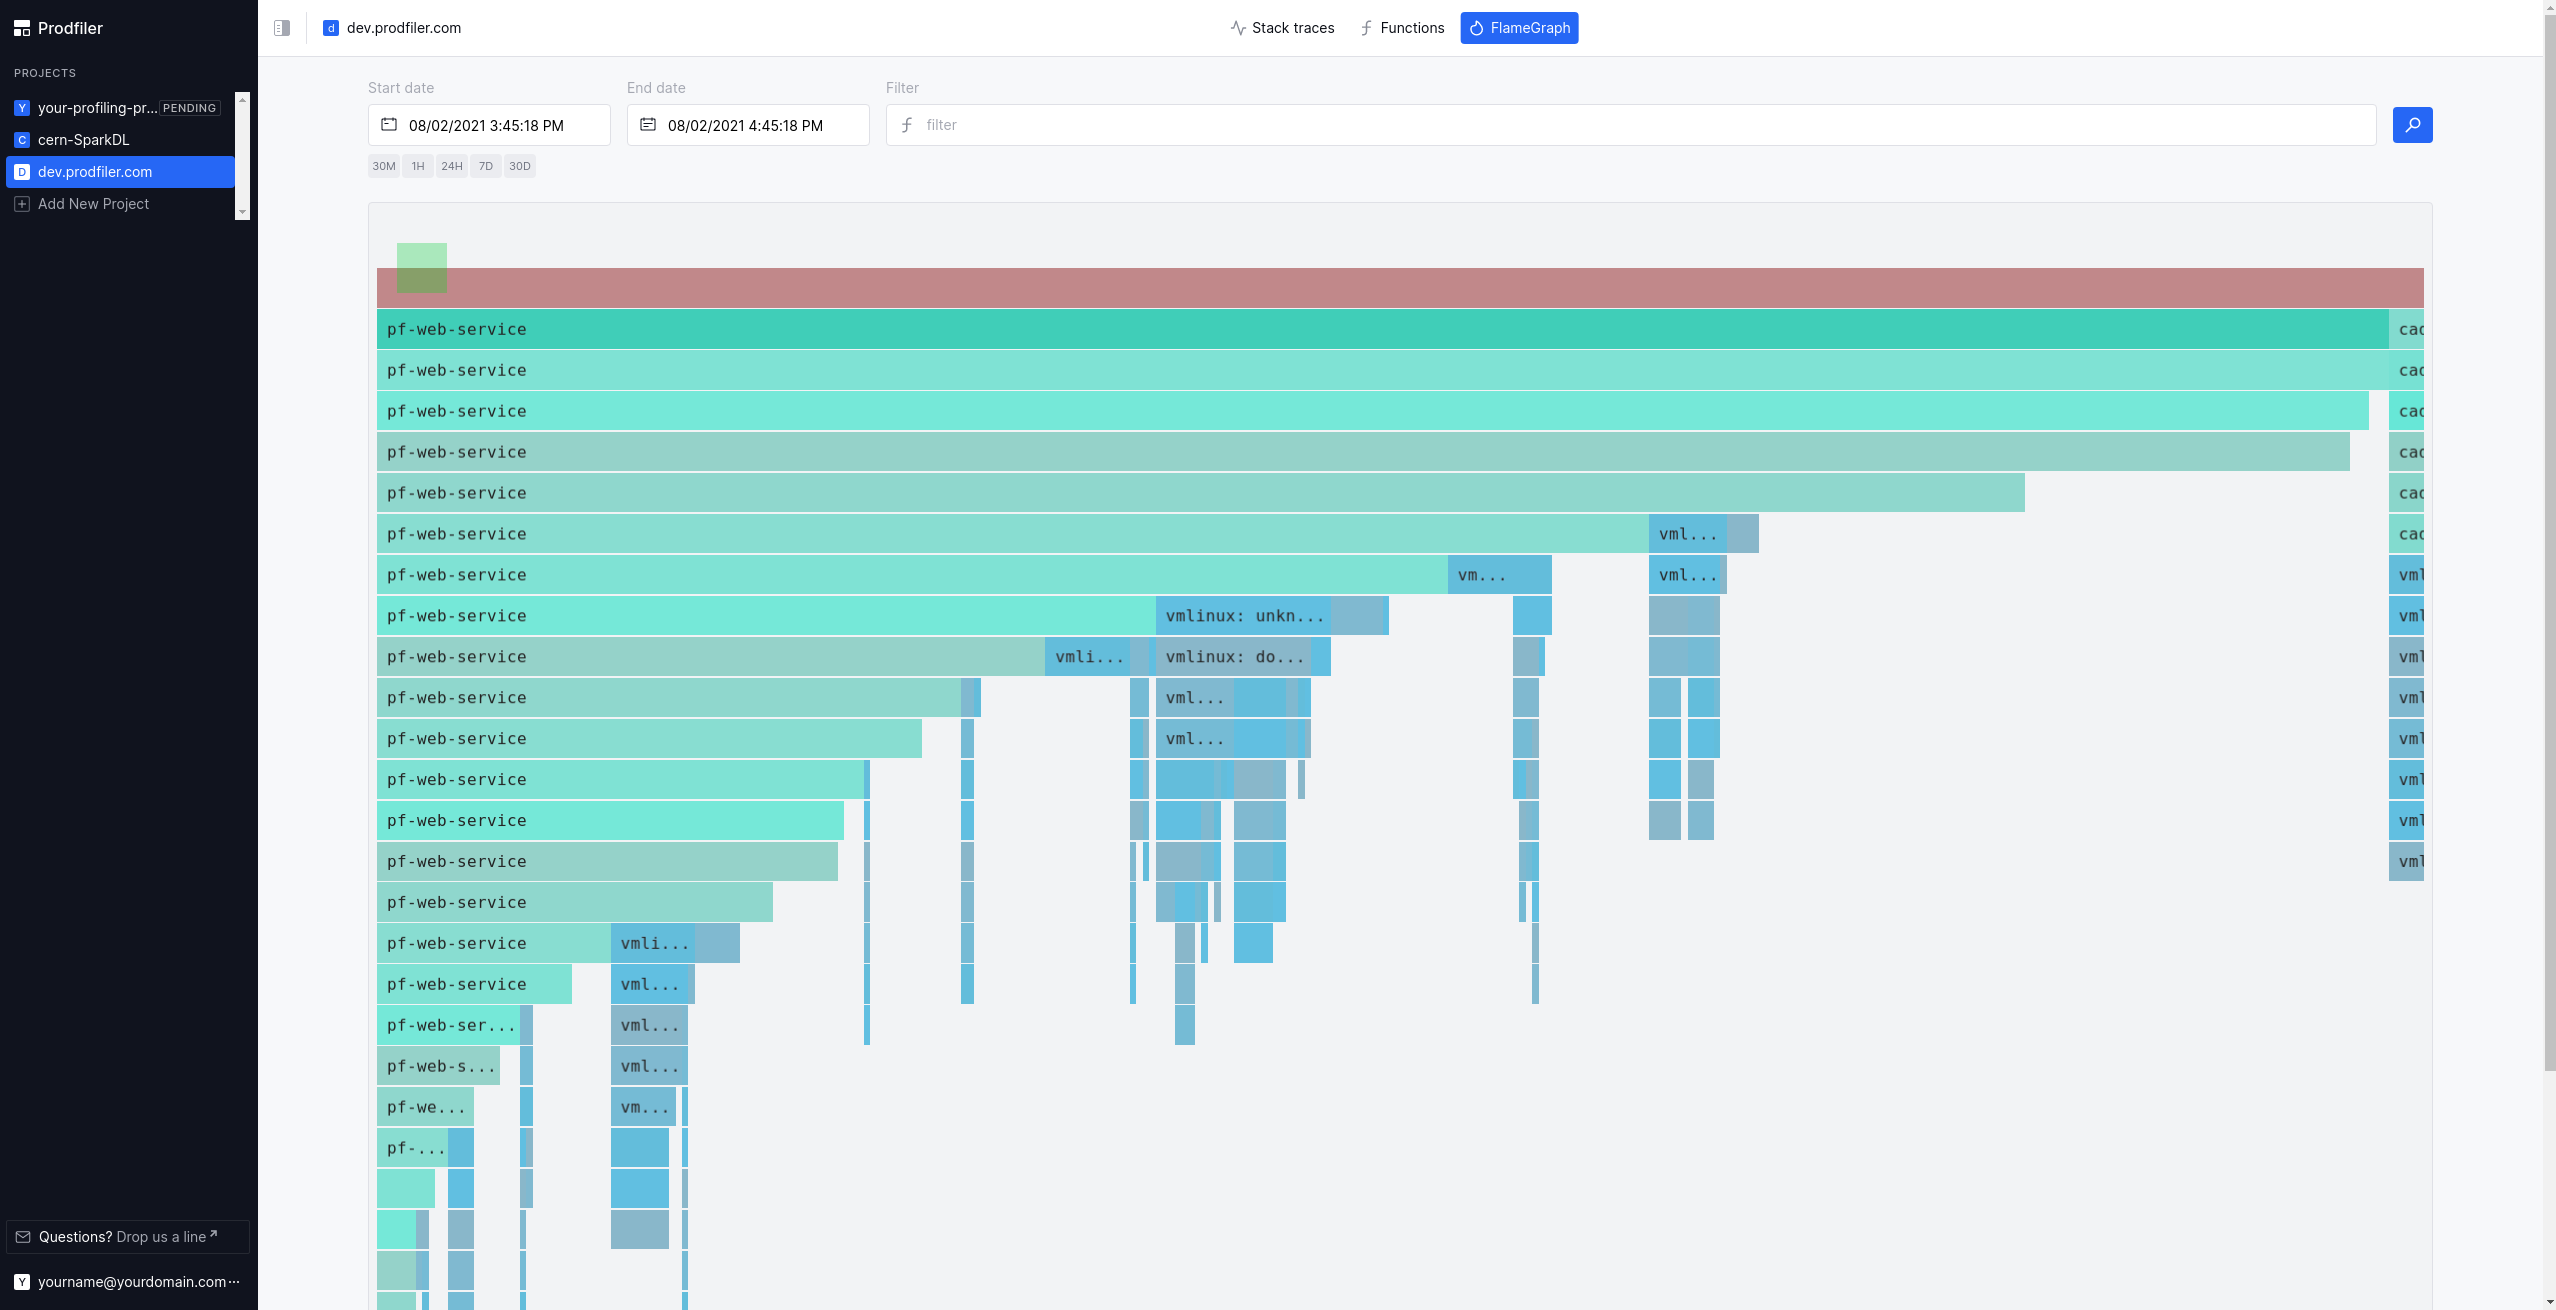
The Flamegraph view
Flamegraphs are a common way of visualizing collections of stack traces. By clicking on the “Flamegraph” button in the top navigation bar, the construction of a flamegraph is triggered on the backend, and the result will be loaded in the browser. Please note that this is a somewhat heavy operation, and it can take 30s or longer to generate and load a flame graph.
The runtimes to which a particular stack frame belongs are marked by different colors: Brown-ish hues represent python, mint-ish hues represent native userspace code, green-ish hues are JVM, and blue-ish hues are from the Linux kernel.
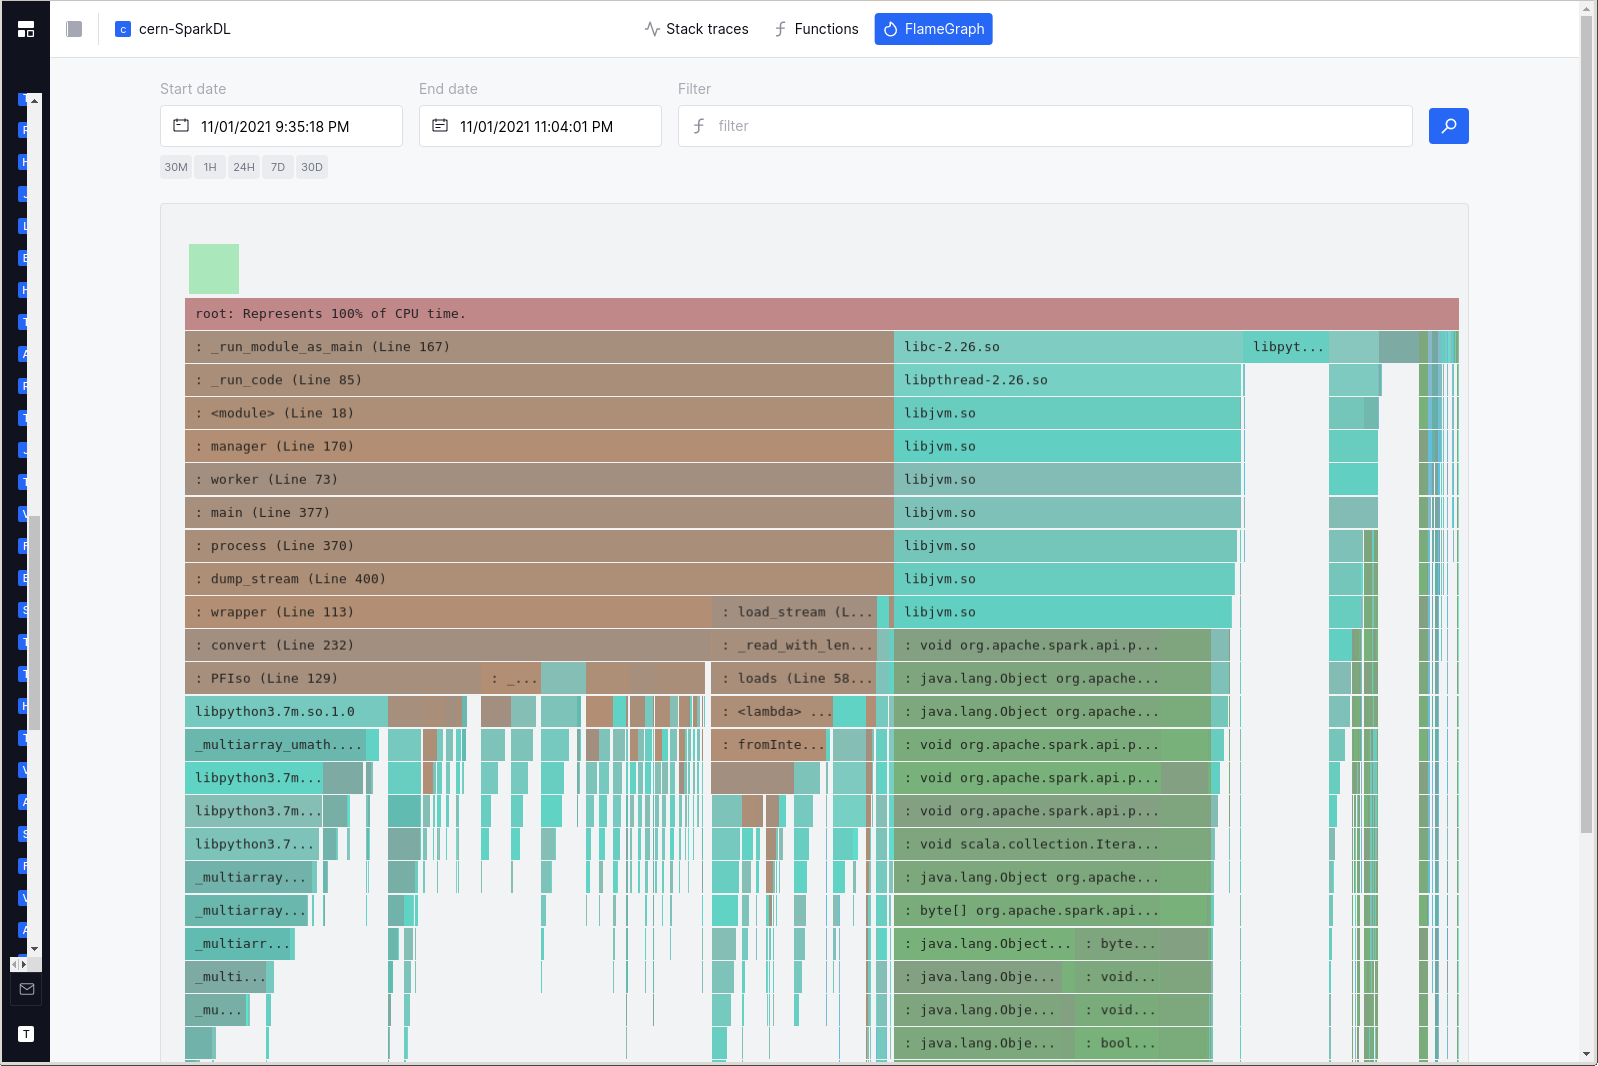
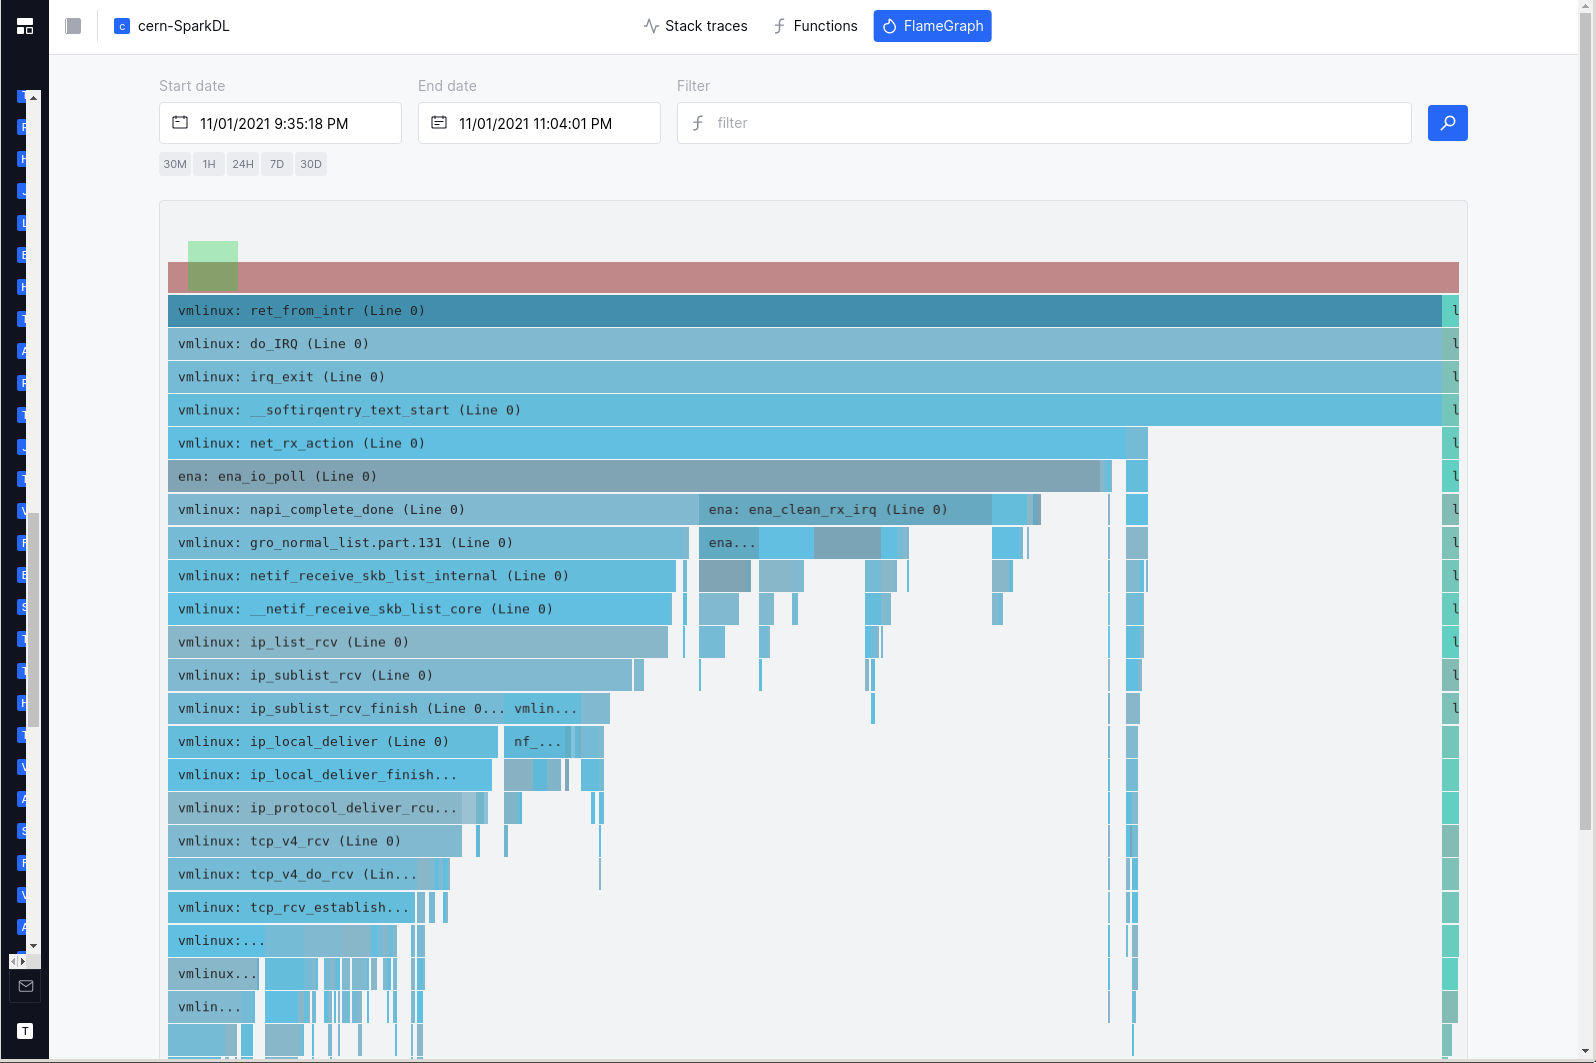
Your mousewheel should allow navigating the flamegraph on the vertical axis; clicking on individual frames will re-scale the flamegraph to make the frame the center of the screen. Clicking on an already-selected frame will pop up a window that provides estimates for the overall CPU consumed by the frame in question - both in the selected timeframe, but also annualized under the assumption that the current workload is representative.
Filtering the results
The filtering language has its own documentation page.
Dealing with missing symbols
By default, Prodfiler should symbolize stack frames for upstream binaries from the Ubuntu and Debian package repositories.
For many other executables, it may happen that Prodfiler does not immediately have access to the symbols in question. This will be visible in the stacktraces and flamegraphs:
In order to provide symbols to Prodfiler, please use the bash script located in ./scripts/upload_symbols.sh.
Please be aware that this process can take some time: Even if the symbols are present in our backend, there can be significant lag (up to 30 minutes) between the backend having the symbols and the corresponding frames being symbolized properly.
Unstripped Golang binaries
For unstripped Golang binaries, the easiest way to get the stack frames symbolized is simply running
./upload_symbols.sh -u [your email address] -d ./[the executable in question]
Please note that this sends the binary to our backend infrastructure! Do not do this if you are not comfortable with the executable being processed and stored outside of your infrastructure.
Stripped Golang binaries
Stripped Golang binaries still retain a lot of the relevant information in the .gopclntab section.
This means you can submit the symbols from these executables by doing
./upload_symbols.sh -u [your email address] -d ./[the executable in question] -p
This has some downsides: In particular, cgo frames will likely not be symbolized. Whenever possible, try to provide full DWARF symbols.
Unstripped C/C++ binaries
Unstripped C/C++ binaries can be uploaded just like unstripped Golang binaries.
C/C++ binaries with separate DWARF file
Many Linux distributions (but also some build systems) generate the DWARF information into a separate ELF file. This is the default on Debian and Ubuntu-based systems.
./upload_symbols.sh -u [your email address] -d ./[the executable in question] -g ./[dwarf file]
Stripped C/C++ binaries
Sometimes it is difficult to get any DWARF information for an already-deployed binary. We are working on a solution that - in extreme circumstances - can be used to import symbols from a similar executable, e.g. the same software and version compiled from scratch. Please reach out if you have a need for this so we can prioritize development accordingly.
Host-agent configuration options
The host-agent supports various configuration options, you can list them running the binary with the -h flag.
- binary
./pf-host-agent -h - Docker
$ docker run --rm -ti optimyze/pf-host-agent:v2.5.4 /root/pf-host-agent -h
The options can be configured with (in order of precedence):
- CLI arguments
- environment variables
- configuration file
CLI flags
The format for flags can either be -flag value or flag=value. Remember to wrap value into single or double quotes
if they contain spaces or special characters that might be interpreted by the shell.
Configuration file
By default, the host-agent will look for a configuration file in /etc/prodfiler/prodfiler.conf.
You can customize the file path with the -config CLI flag.
The file content is expected to be in plain format, as in:
    flag value1
    anotherflag value2
This is the configuration mode used in Kubernetes charts, via a configMap.
Environment variables
The host-agent can be configured with environment variables prefixed with PRODFILER_.
Every CLI flag can be turned into an environment variable that will be parsed with the following conversion:
- remove the flag’s first hyphen
- replace all remaining hyphens with an underscore
- capitalize all letters
- prefix the flag with
PRODFILER_
For example:
| flag | env variable |
|---|---|
-config |
PRODFILER_CONFIG |
-project-id |
PRODFILER_PROJECT_ID |
Description of configuration options
  -cache-directory string
   The directory where prodfiler can store cached data. (default "/var/cache/optimyze")
- This folder must exist on the host where host-agent runs, it will not be created autoamtically by the binary but it’s part of the OS packages and Kubernetes install process.
  -collection-agent string
        The collection agent address in the format of host:port. (default "data.run.prodfiler.com:443")
- Address of collection-agent: customize only if you know you need to send data in a non-default location
  -config string
        Path to the prodfiler configuration file. (default "/etc/prodfiler/prodfiler.conf")
- Path of the configuration file.
  -copyright
        Show copyright and short license text.
- Prints the copyright notice and exit
  -disable-tls
        Disable encryption for data in transit.
- Disables TLS encryption for the communication with collection-agent: set it only if you know you need to send data in an unencrypted, non-default location.
  -no-kernel-version-check
        Disable checking kernel version for eBPF support. Use at your own risk, to run the agent on older kernels with backported eBPF features.
- Allows experimentally running the host-agent on unsupported kernels, disabling the kernel version check.
  -project-id int
        The project ID to store the data in.
- The project ID where profiles fetched by the host-agent will be stored; instructions in the UI will fill it for you.
  -secret-token string
        The secret token associated with the project id.
- The secret token to authenticate with the project ID where profiles will be stored; instructions in the UI will fill it for you.
  -tags string
        User-specified tags separated by ';'. Each tag should match '^[a-zA-Z0-9-:._]+$'.
- User-provided tags to mark profiles for a given host: these tags can be used to filter data in the UI as mentioned in filtering.
  -tracers string
        Comma-separated list of tracers to include. (default "all")
-
The tracers will process stacktraces for various languages: we recommend to use
allto have a holistic view of your applications, with stack traces spanning from user to kernel-space.Valid tracers are:
native: native code, such as C/C++/Rust/Go (includes kernel frames)hotspot: JVM frames (requiresnativeto be included in the list)python: Pythonphp: PHPruby: Rubyperl: Perlv8: NodeJS/V8
More languages will be supported soon!
  -upload-symbols
        Enables automatic uploading of Golang symbols to the Prodfiler service, for symbolization.
- Automatic upload of parts of unknown executables to support symbolizing these frames. Currently supported only for Go executables.
  -verbose
      Enable verbose logging and debugging capabilities.
- Log in verbose mode: set it only when the host-agent fails to start or no data appears in the UI after 10 minutes.